If you’ve ever struggled to get all of the elements in your mix to fit together, you’ll find this post very helpful!
By the way, I’ll be using graphs and audio clips from a presentation by Prof. Dr.-Ing Bernhard Seeber. If you want to hear a more in-depth explanation of this topic, check out the links in the description below to watch his lecture series on YouTube:
What Is Masking?
Masking is a psychoacoustic phenomenon. When the sound of one instrument masks the sound of another instrument, the masked sound could become totally inaudible. Because the sound of even a single instrument is made up of many frequencies, it’s possible for those frequencies to mask one another – in essence, the instrument masking itself!
The principles I’m about to share with you will help you understand why and when this happens. And you can use that information to make better decisions with EQ, compression, and other effects while mixing.
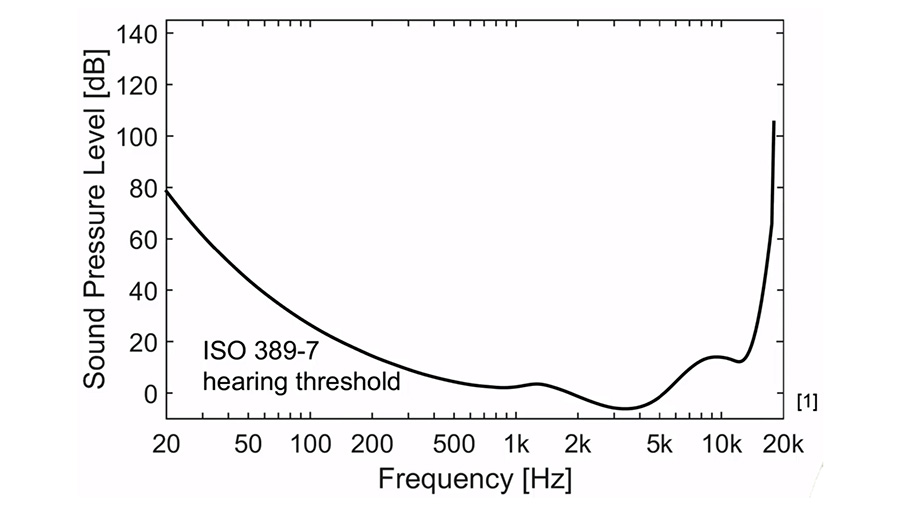
First, I want to show you this graph that describes the threshold of hearing across the frequency spectrum. It’s important that we understand what it is trying to tell us… On the x-axis, we see the range of human hearing in Hertz. It ranges from 20 Hz to 20 kHz. The y-axis shows sound pressure level from 0 dB to 140 dB SPL.
The line that is plotted on the graph represents the threshold of hearing, or the quietest sound pressure level that can be heard at each frequency. It’s measured by playing a tone for a listener at various levels and asking the listener to press a button when they can detect the tone. Notice here that a very low frequency or very high frequency is required to be a much greater in level in order to be heard, when compared to a mid-range frequency.
In addition to measuring the threshold of hearing in a quiet environment, we can also measure the threshold of hearing for a tone in the presence of noise.
A simple experiment might be to play a tone and white noise simultaneously, instructing the listener to report when they hear the tone. By varying the intensity of the tone in relation to the noise, we will find the point where the listener can no longer hear the tone within the noise and the level where the tone is just detectable by the listener.
The results of this experiment will look like this, a graph that is similar to the threshold of hearing graph from before:
This time, the graph shows the minimum audible level for each frequency with white noise as a masker. White noise is energy evenly distributed throughout the frequency spectrum with equal energy density per frequency. I have a full post on the difference between white noise and pink noise.
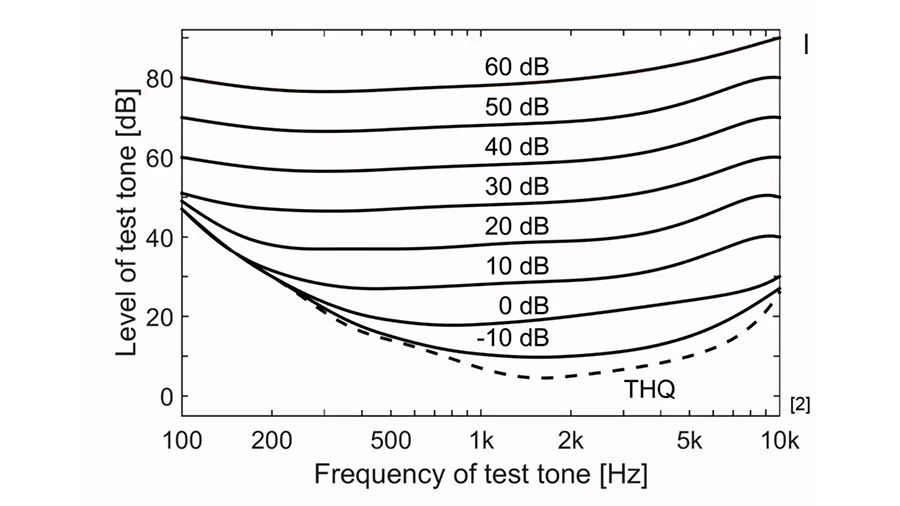
This line represents the results when the level of the noise is -10dB, 0 dB, 10 dB, and so on… This data indicates that each time we increase the level of the noise by 10dB, the tone is required to be increased by 10dB as well to remain audible. You can see that this holds true for tones at all frequencies across the spectrum.
This illustrates one big reason that it is so important to manage hiss and room noise in our recordings. If noise is not kept to a minimum, it will become difficult to hear the quietest details within a recording. Luckily, modern preamps and digital audio equipment have extremely low noise specifications compared to the recording and playback technology of the past. So as long as you use good gain structure, it won’t be a big problem.
White noise is evenly distributed across the spectrum, so it masks a very wide band of frequencies. However, if we filter the noise into narrow-band noise that only contains a specific range of frequencies, we see different masking behavior.
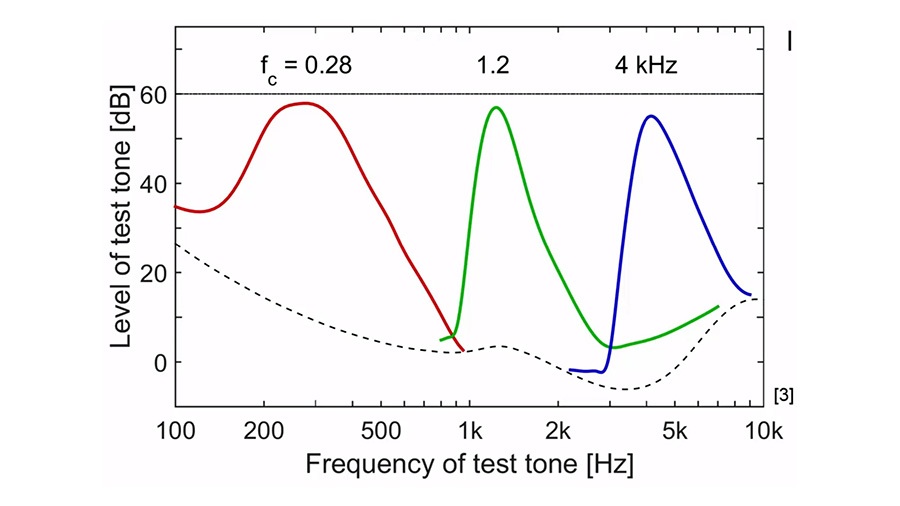
Here, we see that narrow-band noise will primarily mask the frequencies that are contained within the noise and the frequencies just above and below that range. Shifting the center frequency of the noise, we see that the masking shifts too.
This helps explain why you might sometimes have difficulty getting a kick drum and bass signal to work well together. If both the kick and bass occupy the same range of frequencies, they will mask one another. The next time this happens to you, try using an EQ to shape each signal so that they do not compete for the same frequency band.
In addition to the masking effects of white noise and narrow-band noise, we can also look at the masking behavior of a pure tone. Here is a graph showing the masking curve of a 1kHz tone:
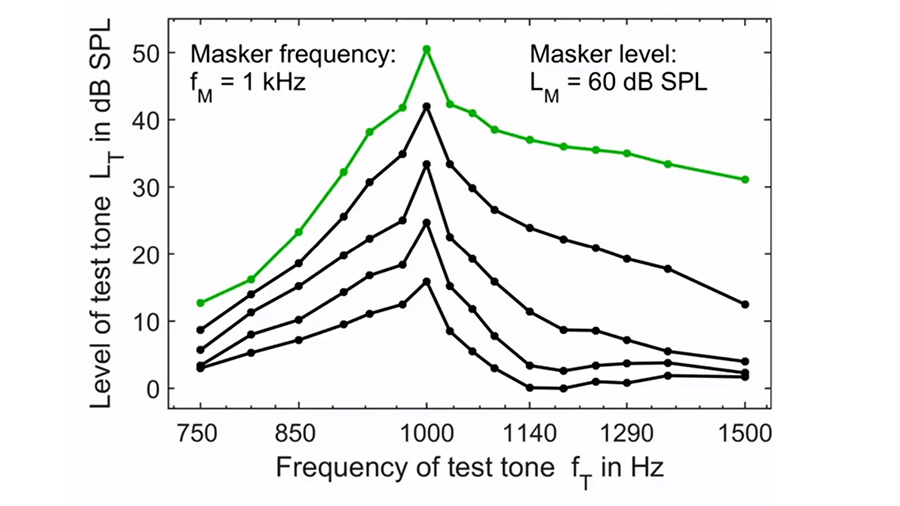
Again, we see that the masking is most effective at 1kHz. And just like with the narrow-band noise, the masking from a 1kHz tone also somewhat extends above and below the frequency of the tone itself.
However, look at the way the results vary as the level of the tone is increased… The 1kHz tone seems to more effectively mask high frequencies compared to low frequencies as the level increases. This is referred to as the upward spread of masking.
Here, we find one of the most helpful mixing tips, especially when it comes to using EQ. Low-frequency components of one instrument may mask the higher-frequency components of other instruments in the mix.
So, when carving out space for each instrument in the mix, consider that the masking will primarily spread upward. This helps explain why cleaning up the mud in the low mids often has an automatic clarifying effect in the mids and high-mids.
There is another lesson we can learn from this… Remember earlier when I mentioned that an instrument can mask itself? This is what I was referring to.
Sometimes an instrument may sound dull, as if it is lacking energy in the high frequencies. While we may be tempted to address this problem by boosting the high frequencies with an EQ, this masking principle suggests that there might be another solution.
Perhaps the signal has enough high-frequency energy, but the lower frequencies within the signal are just masking those higher frequencies. Instead of boosting the highs, maybe we can cut the lower frequencies, reducing the masking that is occurring.
You may have seen some of my posts on ear training for audio engineers, where I show you the vowel method for identifying frequencies. If not, be sure to download my free guide at audiouniversityonline.com/ear-training-guide. Check out this video to get started:
Most instruments and signals are complex, meaning they are made up of several different frequencies. This means that we should be aware of the various components that make up each instrument we are mixing. It’s important to recognize the masking effect that those components have on one another as well as the effect they have on the components of the other signals in the mix.
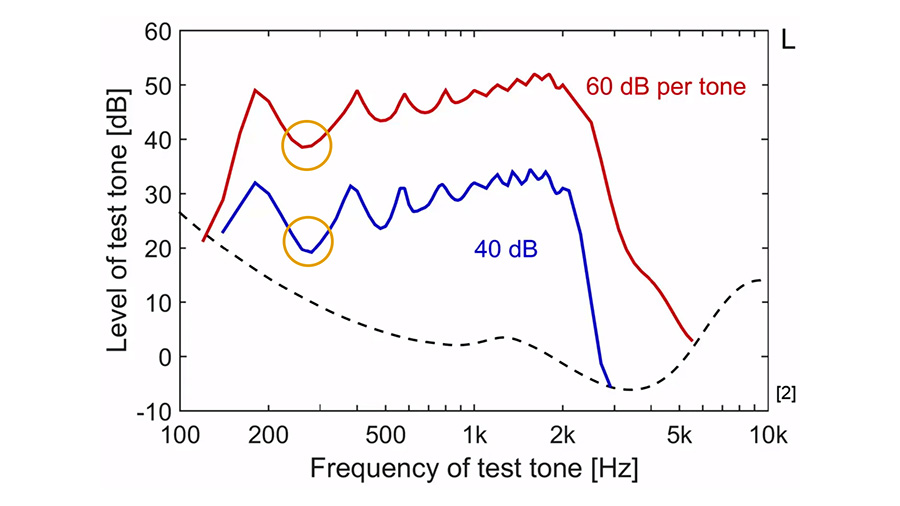
This graph shows an identical set of tones at different levels. Notice that the 20dB increase per tone results in a greater amount of masking at the frequencies between each tone. Remember, the masking potential for each tone extends upward in the frequency spectrum as the level of each tone increases. That fills in those spaces between the tones as the tones get louder.
Keep this in mind as you’re mixing – specifically when you’re choosing your monitoring level. There may seem to be more clarity and space in your mix at lower levels compared to higher levels. It’s important to consider what your mix will sound like when it is inevitably enjoyed at various levels by consumers.