What Is Frequency Response?
The frequency response of a speaker, a microphone, or a pair of headphones describes the device’s ability to pass audio frequencies from its input to its output.
Some devices will pass all frequencies from input to output evenly. Other devices will overemphasize some frequencies while underemphasizing other frequencies.
Let’s take a look at a simple example to understand what this means.
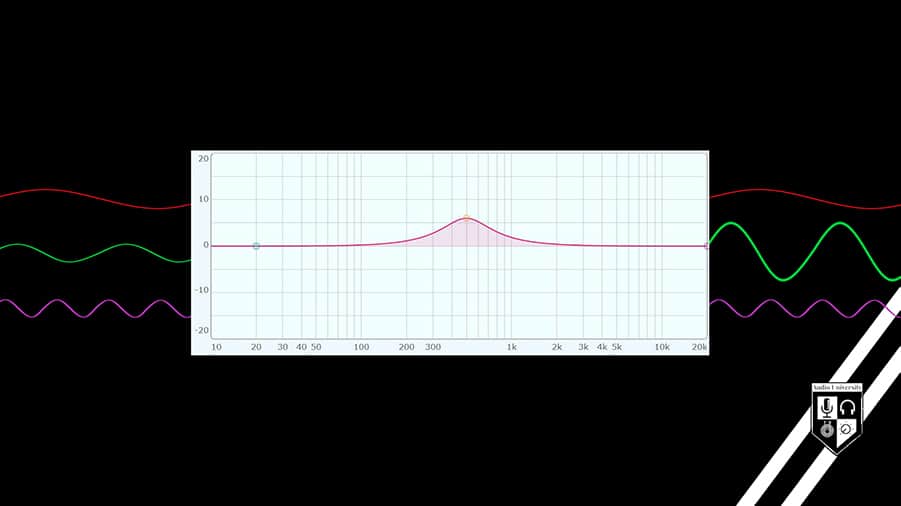
This is a parametric equalizer. It shows frequency on the x-axis. Lowest frequencies on the left, highest frequencies on the right. The level of each frequency is shown on the y-axis. Highest level at the top, lowest level at the bottom.
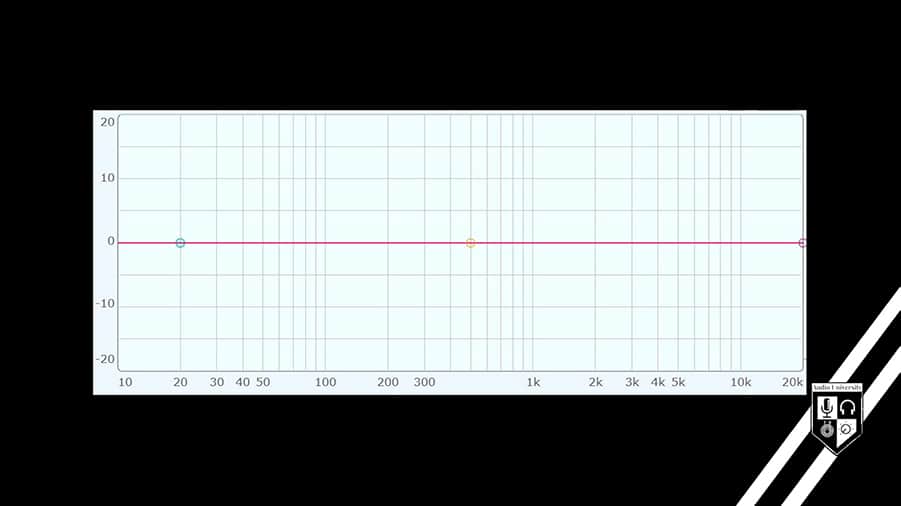
A straight line from left to right tells us that this EQ will not have an effect on the frequency balance of signals passing through it.
As a signal passes from the input of the EQ to the output of the EQ, the balance of frequencies won’t be affected. Therefore, this EQ has a “flat” frequency response.
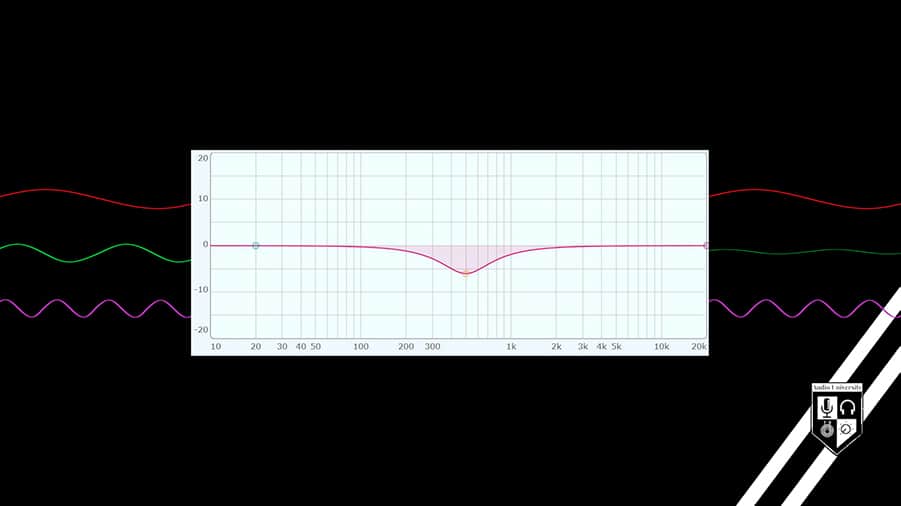
If the equalizer is set like this, with a dip in the mid frequencies, it’s frequency response changes.
Now, as a signal passes from the input to the output of the EQ, some mid frequency energy will be lost. The output signal will have less mid frequencies than the input signal.
The EQ can also be set to boost mid frequencies.
A signal passing through this EQ will have more mid frequency energy at the output than it had at the input.
Frequency Response Graphs & Specifications
Every audio device has a frequency response – not just equalizers.
When shopping for a microphone, a speaker, or a pair of headphones, you will likely be comparing several sets of technical specifications to decide which device best suits your needs.
This section will help you to understand how frequency response is specified and how to interpret those specifications so that you can make an informed decision.
Frequency Response Graphs
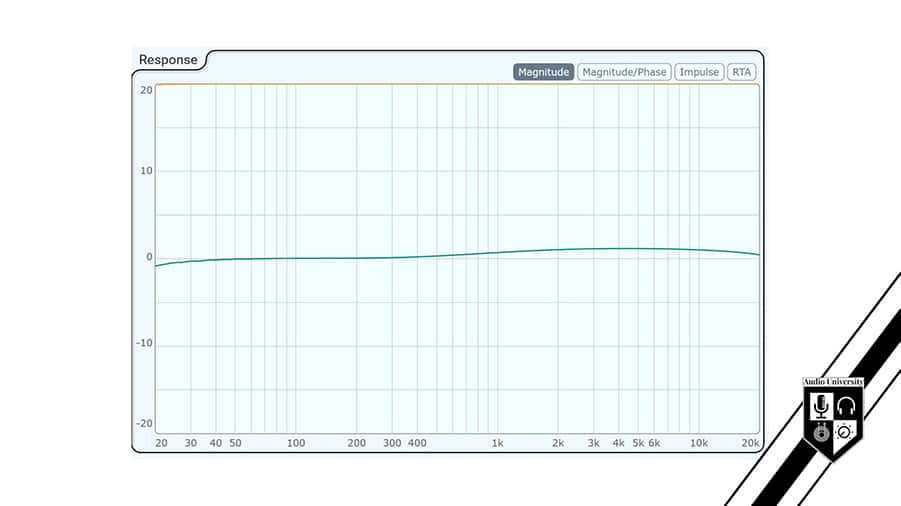
You will often encounter the type of graph shown above, which represents frequency along the x-axis (horizontal) and level along the y-axis (vertical).
It looks like the parametric equalizers shown in the first section, above. This graph represents the difference between the input and output of a device with a relatively flat frequency response with a very slight boost from 500 Hz to 20 kHz.
Let’s take a look at the frequency response of the Shure KSM9 microphone. The center line is the 0 decibel reference point. Some frequencies are accentuated by this microphone. Other frequencies are reduced.
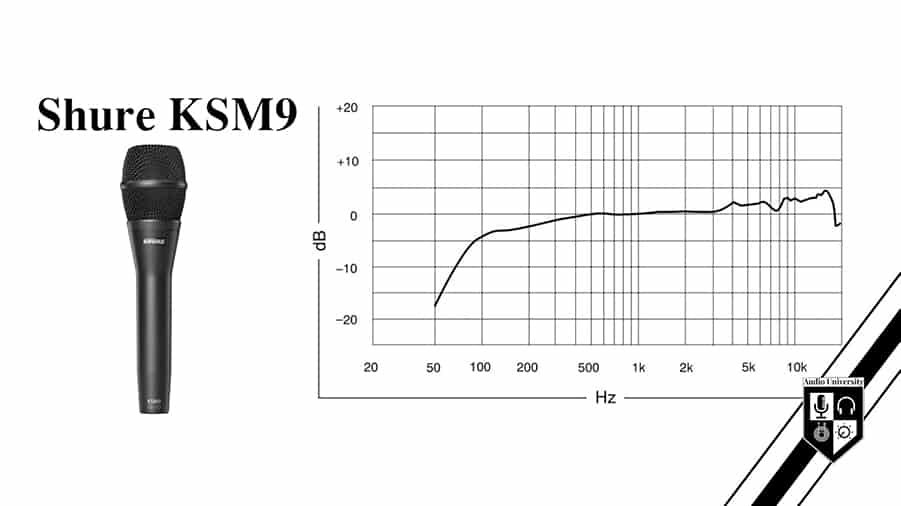
These graphs are the most valuable method for interpreting frequency response, because you can not only see the range of frequencies that can be transmitted by the device, but you can also see the relative level of each frequency within that range.
Comparing Frequency Response Graphs
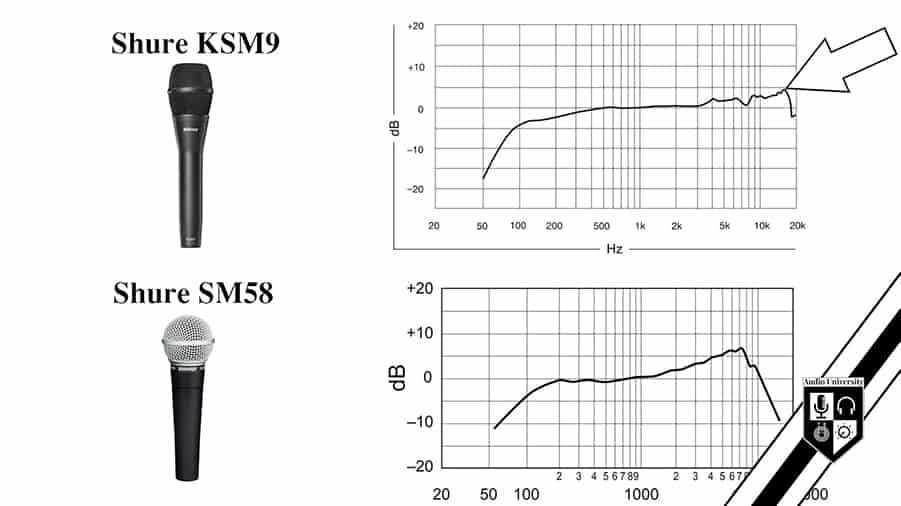
Frequency response graphs are very useful when comparing microphones. Let’s compare the frequency response graphs of a Shure KSM9 to that of a Shure SM 58.
You can see that the KSM9 accentuates more high frequencies but reduces more low frequencies in comparison to the SM58.
This indicates that the Shure KSM9 has a brighter sound, but the Shure SM58 has more accurate low-frequency response.
Other Frequency Response Specifications
Frequency response graphs are the most valuable method for interpreting frequency response because they not only show the range of frequencies a device can pass, but also the relative level of each frequency within that range.
Although graphs are most helpful, many manufacturers do not offer a frequency response graph in their technical specifications.
Frequency Response Range
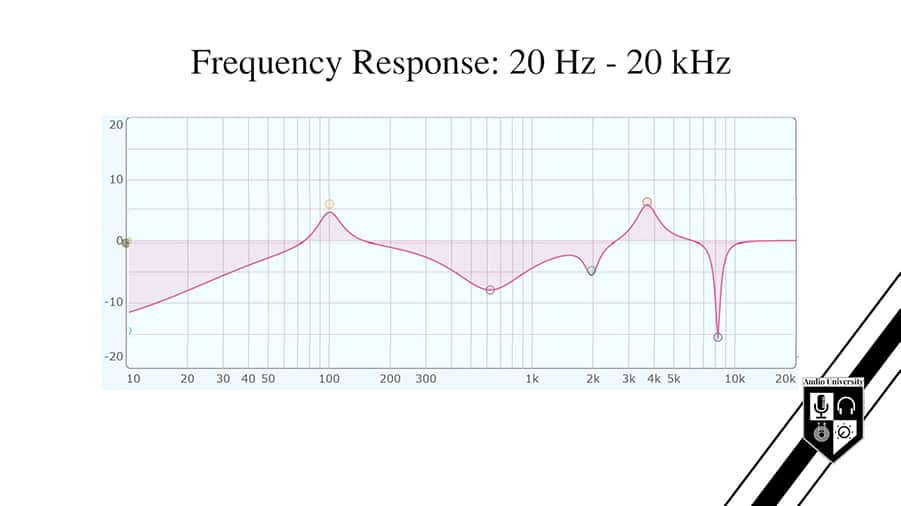
Often, the technical specifications won’t include a graph. In this case, frequency response might be shown like this:
20 Hz – 20 kHz
This style of specifying frequency response includes stating the frequency range. However, this specification would be much more meaningful if it were followed by a very important detail, called a tolerance.
Frequency Response Range with Tolerance
The tolerance tells us the maximum deviation in level over the stated frequency range.
This specification tells us that the Sennheiser HD 820 headphones are capable of passing frequencies between 12 Hz and 43.8 kHz within a -3 dB range:
12 Hz – 43.8 kHz (-3 dB) – Sennheiser HD 820 Headphones
This specification tells us that the JBL 308P MkII studio monitors are capable of passing frequencies between 45 Hz and 20 kHz within a +3 dB or -3 dB range:
45 Hz – 20 kHz (+/-3dB) – JBL 308P MkII Studio Monitors
When a tolerance isn’t stated, the frequency range alone is very vague.
A speaker might be capable of passing frequencies from 20 Hz to 20 kHz, but without a stated tolerance you could be unaware of terrible peaks and dips that might exist along that range.
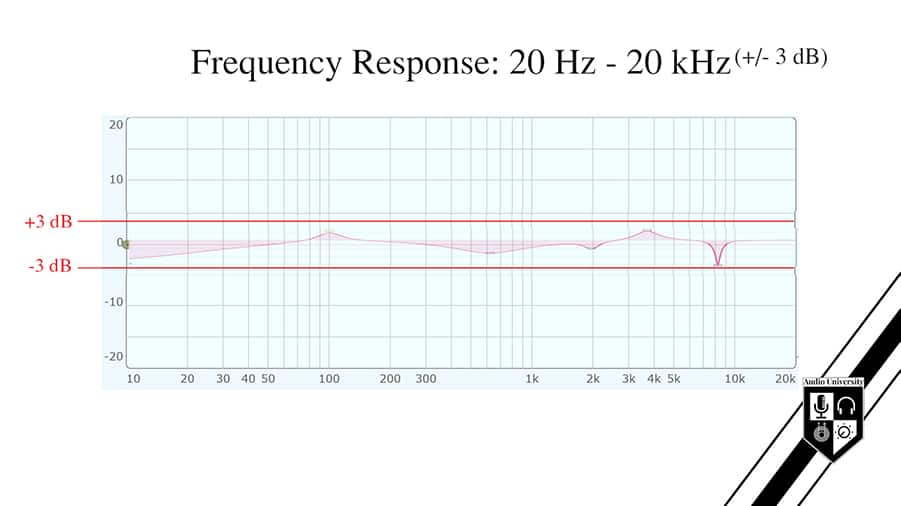
The combination of the range and tolerance tells us that the device’s frequency response ranges from 20 Hz to 20 kHz with a maximum deviation of + 3dB or – 3dB.
While a tolerance of +/- 3 dB is often assumed if nothing is specified, this isn’t always the case. In fact, many manufacturers leave this detail out as a way to embellish the capabilities of a product.
They claim that their product has a frequency response of 20 Hz to 20 kHz, with no indication of the level deviations within that range.
Be aware of this tactic.
What Is a Good Frequency Response?
You might think a flatter frequency response is always better. But that isn’t necessarily the case.
Not all audio production equipment is engineered for a flat frequency response.
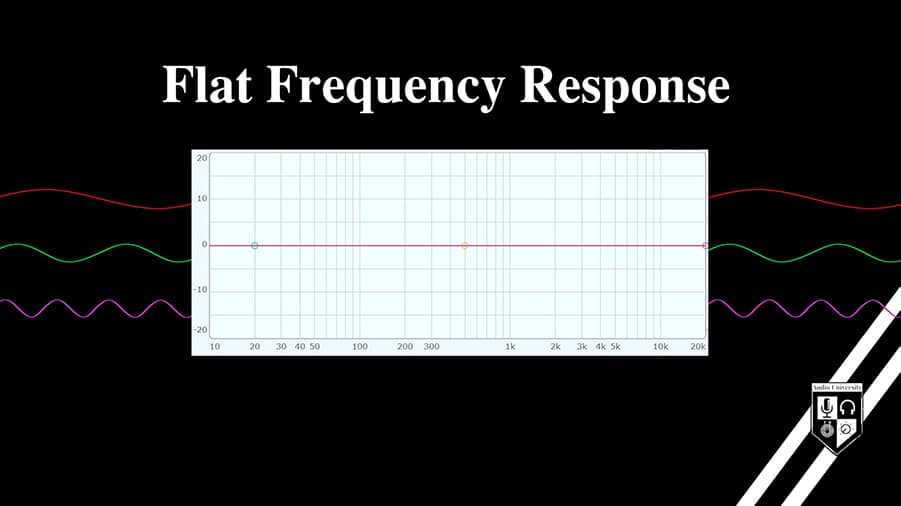
Flat Frequency Response
Some pieces of equipment are designed to be as transparent as possible. Mixing consoles, reference monitors, and reference headphones usually aim for a flat frequency response.
That’s because they are designed to “tell the truth”, so to speak.
These devices intend to have as little an effect on the signal as possible, so that what comes out of the device very closely resembles what went into it.
Specialized Frequency Response
Other devices are designed with a frequency response that is tailored for a specific application.
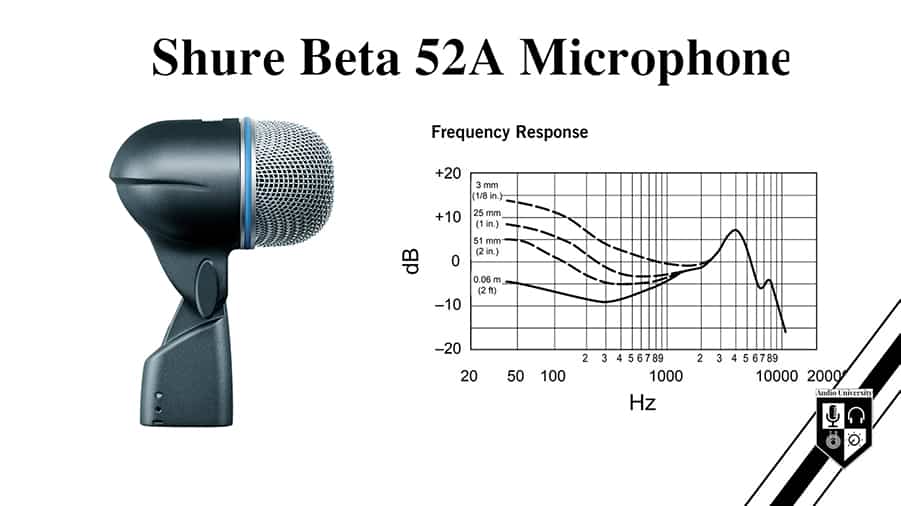
For example, the frequency response of the Shure Beta 52 microphone is specifically engineered for recording a kick drum. It intentionally over represents some frequencies while under representing others.